
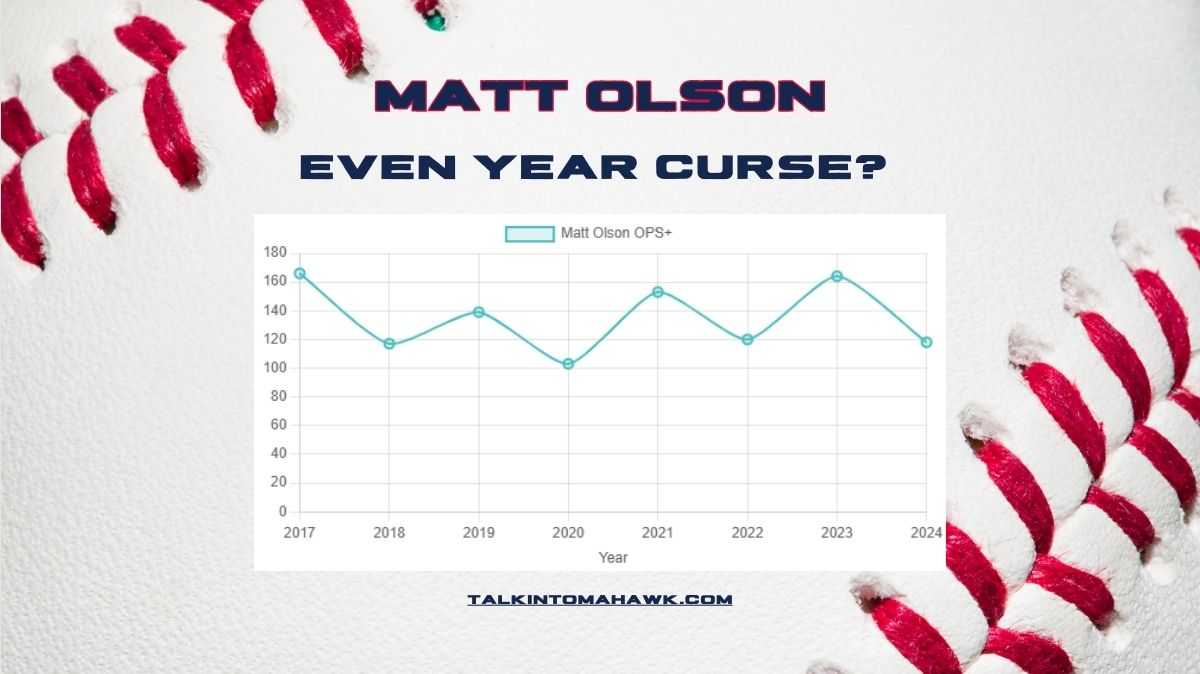
Throughout his career, Atlanta Braves slugger Matt Olson‘s tendency to play worse in even-numbered years has been reflected in his OPS+ numbers. These swings all boil down to severe swings in his slugging percentages and high strikeout-rates. His walk-rates have remained fairly consistent. We dig into the numbers and look for correlations. Could Olson’s power numbers be influenced by how “juiced” the ball is? Is he just a streaky hitter? Let’s dive in.
I want to get one thing clear, even during his “down” years, Olson has never been bad. I’ll give you the exception in 2020’s shortened season, but even then he was still slightly above average in OPS. The problem is that Olson strings together stretches of Hall-of-Fame-worthy dominance. Sometimes he draws that out over a full season.
After sifting through all the numbers, my conclusion is that he’s consistently inconsistent with an extreme range of outcomes. Let’s dive into the numbers anyway… because if you like baseball then you like nerding out on stuff like this.
Table of Contents
Matt Olson Year-by-Year OPS+
- 2017: 166 (59 games)
- 2018: 117
- 2019: 139
- 2020: 103
- 2021: 153
- 2022: 120
- 2023: 164
- 2024: 118
You can clearly see the every other year pattern. At worst (2020), Olson was a league-average hitter in terms of OPS. At best, he’s one of the best hitters in the game. In his other “off years” he’s between 17-20% better than league average. You know you’re one hell of a ballplayer when your “down” years are 20% better than MLB average.
Matt Olson Year-by-Year Batting Average
- 2017: .259
- 2018: .247
- 2019: .267
- 2020: .195
- 2021: .271
- 2022: .240
- 2023: .283
- 2024: .247
2023 was incredible and it took a real deviation in Olson’s batting average to reach such heights. What causes such fluctuations in batting average? Let’s take a look at the underlying metrics for Matt Olson and see how they correlate to his up and “down” seasons.
- 2017: 166 | 41.4% HR/FB (13.7% MLB avg)
- 2018: 117 | 16.1% HR/FB (12.7% MLB avg)
- 2019: 139 | 23.7% HR/FB (15.3% MLB avg)
- 2020: 103 | 24.1% HR/FB (14.8% MLB avg)
- 2021: 153 | 19.3% HR/FB (13.6% MLB avg)
- 2022: 120 | 17.9% HR/FB (11.4% MLB avg)
- 2023: 164 | 27.8% HR/FB (12.7% MLB avg)
- 2024: 118 | 15.5% HR/FB (11.6% MLB avg)
The good news is that last season was the worst HR/FB ratio of Matt Olson’s career. It’s not an ideal way to follow-up a career high in 2023 (if you exclude 2017’s 59 games). You also see that the HR/FB rates MOSTLY move with the “Great” seasons with exception to 2020. In 2020, his HR/FB rate was over 20% and was in fact 62.8% above league average, and yet his OPS+ was just 103.
Matt Olson Year-by-Year Swings on Pitches Outside the Zone
Now we’ll compare his OPS+ results with his O-Swing rates and O-Contact rates. O-Swing % is the percentage of swings at pitches outside the zone. The second number will be the O-Contact %, which is the percentage of swings outside the zone made contact.
- 2017: 166 | 22.3% | 50%
- 2018: 117 | 20.4% | 59.1%
- 2019: 139 | 24.8% | 65.5%
- 2020: 103 | 19.1% | 50.0%
- 2021: 153 | 22.7% | 63.6%
- 2022: 120 | 29.0% | 61.3%
- 2023: 164 | 26.0% | 64.3%
- 2024: 118 | 29.3% | 65.3%
One thing we do know is that in the two seasons Olson swung at 29.0%+ he had “down” years. It’s also worth noting that his third-highest O-swing rate came in his greatest season. Olson’s lowest O-swing rate came in his worst season (2020), however, he had a career-high strikeout percentage that season. One thing that sticks out about last season, is that Olson set a career-high in swings outside the zone and also made contact with those pitches at the second-highest rate of his career.
Matt Olson Year-by-Year K%
- 2017: 166 | 27.8%
- 2018: 117 | 24.7%
- 2019: 139 | 25.2%
- 2020: 103 | 31.4%
- 2021: 153 | 16.8%
- 2022: 120 | 24.3%
- 2023: 164 | 23.2%
- 2024: 118 | 24.8%
Outside of 2020’s 31.4% K-rate and the drastic correction in 2021 down to 16.8%, he’s been pretty consistent. His career K-rate is 23.7%.
Matt Olson Hard-Hit % | HR/FB Ratios | Barrel %
- 2017: 166 | 40.3% | 41.4% | 14.0%
- 2018: 117 | 47.3% | 16.1% | 11.5%
- 2019: 139 | 50.3% | 23.7% | 14.2%
- 2020: 103 | 42.9% | 24.1% | 12.8%
- 2021: 153 | 36.3% | 19.3% | 12.7%
- 2022: 120 | 39.3% | 17.9% | 13.6%
- 2023: 164 | 42.7% | 27.8% | 16.4%
- 2024: 118 | 35.9% | 15.5% | 12.4%
Every time Olson had a barrel rate of 12.8% or lower, he had one of his “down years” with an exception in 2021. However, in 2021, Olson slashed his strikeout rate to 16.8%. There could be something to be said about putting the ball in play more often.
Matt Olson Year-by-Year vs. Pitch Types
Below will see a year-by-year breakdown of Matt Olson’s:
OPS+ | SLG vs. Fastballs / SLG vs. Breaking Balls / SLG vs. Offspeed
- 2017: 166 | .729/.593/.464
- 2018: 117 | .448/.457/.477
- 2019: 139 | .565/.475/.609
- 2020: 103 | .474/.347/.378
- 2021: 153 | .596/.457/.478
- 2022: 120 | .517/.351/.582
- 2023: 164 | .630/.551/.617
- 2024: 118 | .499/.358/.485
In 2017, he burst on to the scene with 59 games and deployed destruction against fastballs.
In 2018, the law of large numbers kicked in and the league learned more about how to pitch to the kid. His SLG on fastballs dropped from .729 all the way down to .448.
In 2019, he slugged a phenomenal .609 on offspeed pitches.
In 2020, he played 60 games in the COVID-shortened season and unsurprisingly had poor slugging percentages to match his poor overall production and his 31.4% k-rate.
In 2021, he had a 153 OPS+ and was steady against all three pitch types. He handled offspeed and breaking balls well, slugging above .450 on each, and he crushed fastballs at a .596 clip.
In 2022, the only glaring dip in production came against breaking balls.
In 2023, Olson set the franchise slugging records on fire and he absolutely destroyed every pitch type.
Last season, was one of three seasons in which he didn’t slug at least .500 against any pitch type. Those three seasons represent the three lowest OPS+ seasons of his career.
Could Matt Olson’s Success Ride on the Juiced Ball?
One correlation of note has to do with the juiced ball. It’s been documented that Major League Baseball has been tinkering with the “juiciness” of the ball in recent years. One disconcerting correlation we’ve seen is that as the league’s HR/FB rate goes, so does Matt Olson’s. On a positive note, no matter where he league average is, Olson’s HR/FB ratios are considerably higher. However, it appears that as the overall league sees more flyballs sail out of ballparks, Olson’s numbers take off.
| Year | Olson’s HR/FB Ratio | MLB HR/FB Ratio |
| 2017 | 41.40% | 13.70% |
| 2018 | 16.10% | 12.70% |
| 2019 | 23.70% | 15.30% |
| 2020 | 24.10% | 14.80% |
| 2021 | 19.30% | 13.60% |
| 2022 | 17.90% | 11.40% |
| 2023 | 27.80% | 12.70%* |
| 2024 | 15.50% | 11.60% |
It could be a coincidence, but Olson’s three worst HR/FB ratios since 2017 also match up with the lowest HR/FB ratios for the entire league. It is also worth noting that in 2023, the league’s HR/FB ratio of 12.70% was exactly the same as it was in 2018 and that did not stop Matt Olson from having his power season.
Conclusion
Last season Olson’s second-worst OPS+ since his second full season. He had the lowest hard-hit percentage of his career and the second-lowest barrel rate of his career. As a result, it was one of just three seasons in which he did not slug more than .500 on any pitch type.
Olson is a streaky hitter who can go cold for weeks or even months at a time. Then, he can save a season with some of the hottest stretches in the game of baseball. Olson figured it out in August of last year. He hit 12 of his 29 homers in the final two months. He didn’t have an OPS over .797 for any one of the first four months of the season and dipped to a sorrowful .612 in July. Then he finished with a .911 in August and a .954 in September. Check out this great analysis by Fangraphs on the difference between Olson’s first and second halves of 2024.
Olson still had a ton of red on his Baseball Savant page.

In 2021, Olson drastically cut his strikeout rates down and was able to overcome some of the dips in his hard-hit numbers. For example, 2021 was his 3rd-lowest barrel rate and yet he posted a 153 OPS+. It was the only odd-numbered season in which Olson’s HR/FB ratio was below 20%.
Also keep in mind, when we talk about low barrel rates for Olson, they are still among the best in the league (as seen in image above). The vast majority of Major-League players are envious of having a “down” year in which they club 29 homers as Matt Olson did in 2024.
Last season, Olson struck out too often, swung at pitches out of the zone too often, and as a result, made a lot less solid contact.
Olson has struck out at least 167 times in all three of his season in Atlanta thus far. His career average is .254 and he hit .247 last year.
Olson at his worst is still typically around 17-20% better than league average (in terms of OPS). He’s a tremendous defensive first baseman. He always has power. He gets takes walks with the best of them. We can always refer back to his 2023 season to know what he’s capable of if he can stay consistent.
Will Matt Olson bounce back in 2025?
We think Olson had some bad luck in 2024. However, his style lends itself to bouts of streakiness. I believe his ability to hit the ball so hard will result in better output in 2025. I wouldn’t expect a career year like 2023 again, but I’ll hope for it.
We would love to see Olson strike out less, swing at fewer pitches out of the zone, and take care of the meatballs over the plate (.499 SLG on fastballs in 2024 was third-lowest of his career).
Do you think Olson can replicate his magical 2023 production again? Do you think his power numbers are influenced by Major League Baseball’s tinkering with the juiciness of the ball? Let us know in the comments!

Leave a Reply